In the previous posts, we discussed the Grafana Stack's components and how to set up a single-node deployment. Now, let's bring it all together by exploring how to visualize and analyze logs, metrics, and traces within Grafana. We'll use a simple example application, instrumented with OpenTelemetry, to generate the data, demonstrating the power of unified observability.
Understanding OpenTelemetry
OpenTelemetry (often abbreviated as OTel) is an open-source observability framework providing APIs, SDKs, and tools to generate, collect, and export telemetry data (traces, metrics, and logs). It standardizes how observability data is produced and transmitted, promoting vendor neutrality and simplifying instrumentation across diverse systems.
Why OpenTelemetry for Observability?
OTel is crucial for modern observability because:
- Standardization: Instrument your application once and send data to various backends without code changes.
- Three Pillars: Directly supports collecting traces (request flow), metrics (numerical data), and logs (event records), increasingly with correlation.
- Vendor Neutrality: Offers flexibility to choose your preferred observability tools.
- Rich Ecosystem: A growing community provides SDKs and integrations for many technologies.
Sample Application Overview
To illustrate the concepts, we'll utilize a basic Go web service that simulates a "request processing" workflow. This application is designed to generate the three pillars of observability data:
- Logs: It outputs log messages to
stdout, which Grafana Alloy will collect and forward to Loki. - Metrics: It produces standard HTTP metrics, such as a counter for total requests and a gauge for current active requests, which Prometheus will scrape.
- Traces: It emits distributed traces, including spans for the main request handler and simulated internal operations, which Tempo will ingest.
This example application serves as a practical data source to help us understand how to query and visualize different types of observability data within Grafana.
To keep the article focused, and to not get into framework specifics I won’t be discussing the Go application in detail here. Its source (along with the manifest for docker-compose) can be found at riyaz-ali/observability-with-grafana-stack.
Running the application
To generate some sample data you need to run the application and generate some artificial load.
To start the application and bring up the stack run:
docker-compose up -d
Once the stack is up, make some API calls and generate some traffic. The repository comes with a k6 script k6-script.js that you can use to generate some load. To apply the k6 script, run:
k6 run k6-script.js
This will generate some traffic and cause the application to emit logs, metrics and traces that we can then view in Grafana.
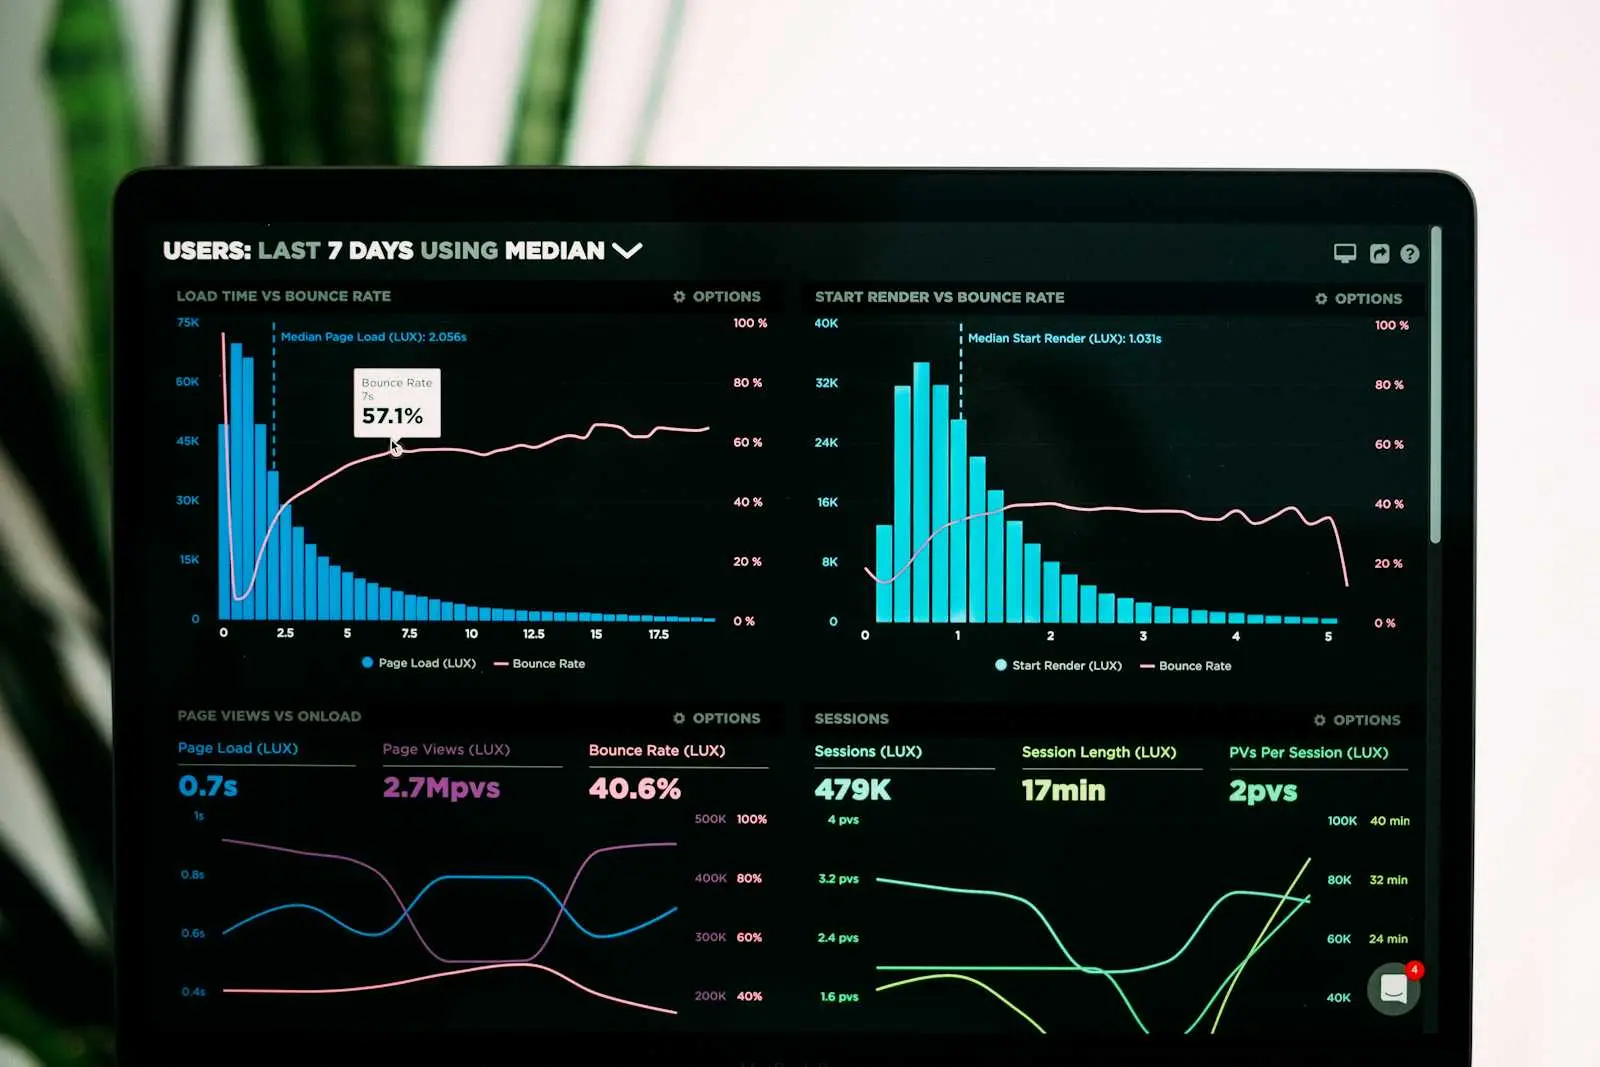
Exploring Data in Grafana
Now, let's dive into Grafana and see our observability data! This is where the real magic happens ✨
Logs with Loki
- Go to Grafana’s Explore view and select Loki from the data source dropdown
- In the LogQL query input, try the following queries to filter and view logs from the application
{service_name=”jokes”}: this will show all logs emitted by the application{service_name="jokes"} | json | level="info": this will show allinfologs{service_name="jokes"} | json | level="info" | line_format "ip={{.remote}} path={{.path}}": you can also reformat the log line usingline_formatoperator
- I encourage you to play around with different operators and filters in LogQL ✌️
Metrics with Prometheus
- Go to Grafana’s Explore view and select Prometheus from the data source dropdown
- In the PromQL query input, try the following queries to explore metrics generated from the application
rate(joke_fetched_total{job="jokes"}[1m]): this shows the per-second rate of “how many jokes were fetched”. This shows how a custom, business-specifc metric can be queried and visualisedsum (rate(http_requests_total{job="jokes"}[1m]))andsum(rate(http_error_total{job="jokes"}[1m]))shows the Requests/sec and Errors/sec rate. This also demonstrates how separate metrics can be plotted on the same graph to better understand the numbers in context.
In later articles in this series, we will deep-dive into more complex queries and visualize key latency metrics such as P95, P90 and P70, undertsand what they mean and how we can query them using Prometheus.
Traces with Tempo
- Go to Grafana’s Explore view and select Tempo from the data source dropdown
- In the TraceQL query input, try the following queries to view traces generated from the application
{resource.service.name="observability-with-grafana" }: will show all traces generated from application{resource.service.name="observability-with-grafana" && status=error}: will show traces where an error had ocurred
When you select a specific trace it’ll open a detailed view showing a flamegraph of the trace and all the nested spans.